Compound Interest
Works Both Ways
Technical Debt & the Choices We Make
The Power of Compound Interest
$10,000 → $76,122
Investment at 7% over 30 years
- Small, consistent investments
- Exponential returns over time
- Earning returns on your returns
It Works in Reverse Too
$10,000 debt at 18% APR
Debt grows exponentially
- Small, consistent shortcuts
- Exponential cost over time
- Paying interest on interest
The Translation to Software
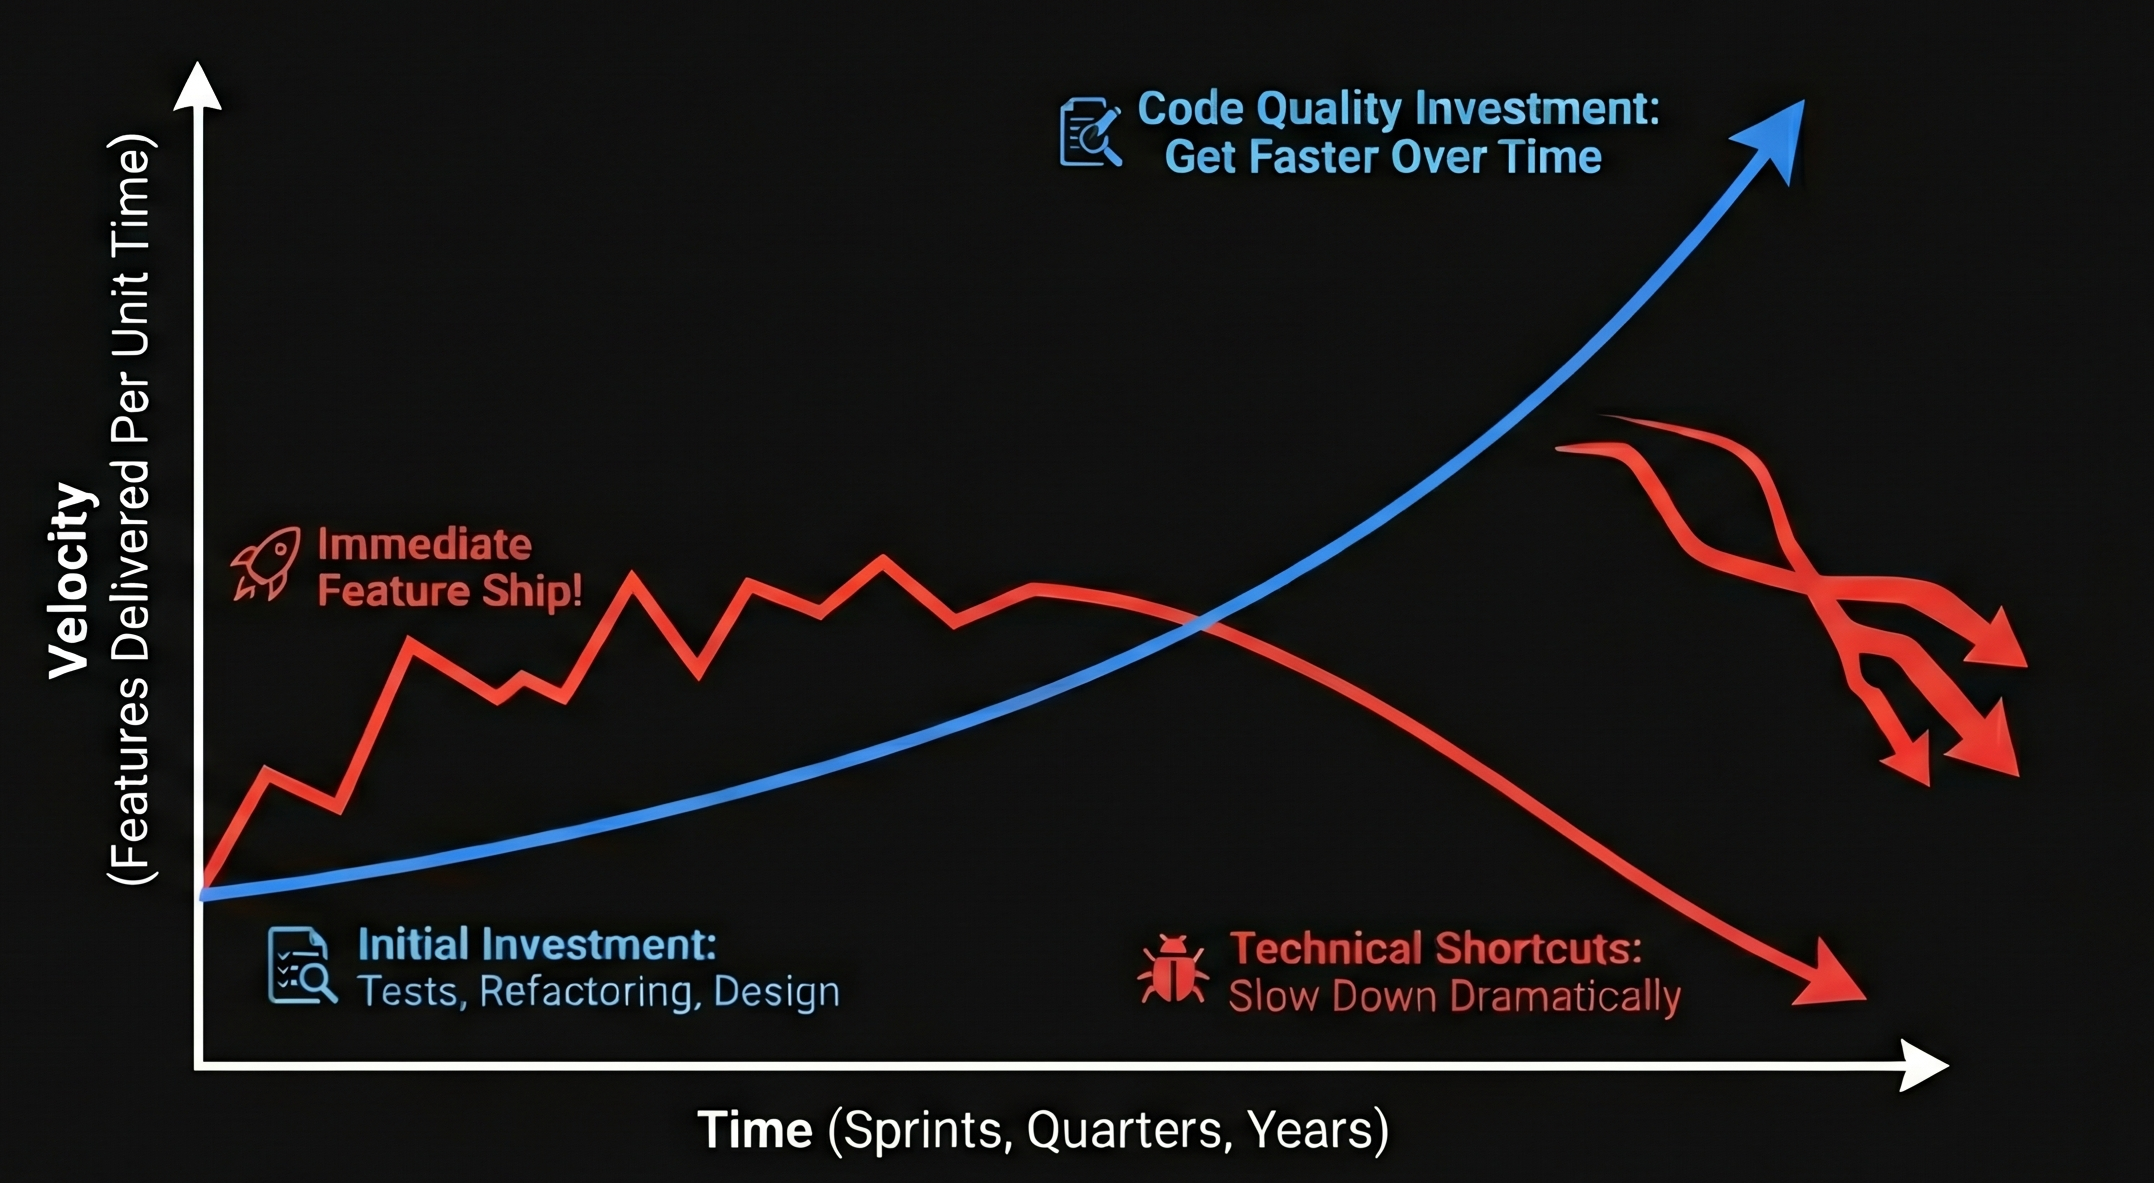
Every shortcut = borrowing from future velocity
The gap compounds DAILY
The Visibility Problem
🏠 Obvious Problems
Roof leak with water pouring in
→ Fixed immediately
🏗️ Invisible Problems
Foundation cracks, slow builds, unreliable tests
→ Gets normalized
"That's just how things are here"
What Invisible Looks Like
Real metrics from a team living on credit
Cycle time: 2 days → 3 days → 5 days → 8 days
Build time: 10 min → 15 min → 25 min → 45 min
Deploy frequency: Daily → 3x/week → Weekly → Bi-weekly
Each quarter, the interest comes due
The Prevention Paradox
🚒 Developer A: Firefighter
- Ships features fast
- Spiky, chaotic timeline
- Late nights, heroic saves
- ⭐ MVP Award - Q4
👷 Developer B: Architect
- Takes a bit more time up front
- Smooth, steady timeline
- Boring, predictable
- 📭 (no award)
Who gets recognized? Who gets promoted?
The Prevention Paradox
Developer A's Impact
- Fixed 12 production incidents
- Worked 6 weekends
- Each incident cost 40 hours
- Visible work
Developer B's Impact
- Prevented incidents through design
- Zero weekend pages
- 480 hours saved
- Invisible excellence
We celebrate the crisis. We ignore the prevention.
What Gets Celebrated?
Show me your last 5 recognition awards.
I'll show you what your organization actually values.
False Urgency vs. Real Crisis
❌ False Urgency
- ♾️ Perpetual state
- ❌ No recovery plan
- 🔁 "Just how we work"
- 📉 Normalized chaos
✅ Real Crisis
- ⏰ Time-boxed (hours/days)
- 📋 Explicit recovery plan
- 🎯 Truly exceptional
- 📊 Measured return to normal
If it's been "urgent" for 6 months...
It's not urgent. It's your culture.
The Choice
You didn't stumble into technical debt.
You CHOSE it.
We Don't Measure What Matters
✅ What We Track
- Revenue
- Headcount
- Story points / Velocity
- Features shipped
❌ What We Ignore
- Cycle time trends
- % Unplanned work
- Lead time for changes
- Change failure rate
If you don't measure it, you've decided it doesn't matter.
The Path Forward
The good news:
You can choose differently.
Starting today.
Make Trade-offs Explicit
Should we ship this feature now?
Option 1: Ship with shortcuts
- Cost: +2 weeks to next feature
- Risk: High
- Debt: Accumulates
Option 2: Ship with quality
- Cost: +3 days now
- Risk: Low
- Debt: None
Stop pretending you're not making trade-offs.
Start making them CONSCIOUSLY.
Metrics That Matter
These four metrics reveal your true health
1. Cycle Time Trend
Flat or declining = good
2. % Unplanned Work
Should be <25%
3. Lead Time for Changes
Commit to production
4. Change Failure Rate
Rollbacks/hotfixes
Metrics Explained: Productivity
1. Cycle Time
What it measures: Time from start work to deployed to production
What it tells you: Are you slowing down over time?
✓ Good: Flat or declining trend
⚠ Warning: Increasing trend = debt
2. % Unplanned Work
What it measures: Time on interruptions, bugs, incidents vs. planned work
What it tells you: How much are you firefighting?
Metrics Explained: Deployment Quality
3. Lead Time for Changes
What it measures: Time from committing code to running in production
What it tells you: How painful is your deployment process?
⚠ Warning: Days/weeks = deployment fear
4. Change Failure Rate
What it measures: Percentage of deployments requiring rollbacks or hotfixes
What it tells you: Your quality level and testing effectiveness
✓ Good: <15% failure rate
⚠ Warning: >30% = quality problems
What to Celebrate Instead
❌ BEFORE (Current State)
- 🏆 "Firefighter of the Month"
- 🏆 "Weekend Warrior Award"
- 🏆 "Incident Response Hero"
✅ AFTER (New State)
- 🏆 "Smoothest Release - Zero Issues"
- 🏆 "Best Test Coverage Improvement"
- 🏆 "Eliminated Entire Category of Bugs"
Celebrate boring. Celebrate prevention.
Celebrate sustainability.
Cultural Shifts
| From |
To |
| "Ship fast, fix later" |
"Ship sustainably" |
| "We don't have time for tests" |
"We can't afford NOT to test" |
| "That's legacy code, don't touch it" |
"We invest in our foundations" |
| "Who can work this weekend?" |
"Why did this become urgent?" |
| "Move fast and break things" |
"Move fast by NOT breaking things" |
Example: Team A's Journey
Starting Point (Q1)
- Cycle time: 7 days
- Unplanned work: 45%
- Deploys: 1x/week
- Team morale: Low
6 Months Later (Q3)
- Cycle time: 3 days
- Unplanned work: 18%
- Deploys: Daily
- Team morale: High
Example: Team A's Journey
What They Did
- Dedicated 20% time to debt paydown
- Invested in deployment tooling
- Stopped rewarding firefighting
- Tracked cycle time publicly
Example: The Build Time Investment
Investment:
- 2 engineers, 1 sprint
- Focus: Cut build time from 45min to 8min
Return (per quarter):
- 10 builds/day × 37min saved = 370 min/day
- 6.2 hours/day saved
- ~400 developer hours saved/quarter
Example: The Build Time Investment
ROI: 10x in first quarter alone
Prevention pays for itself. Quickly.
Small Steps, Big Impact
Month 1
- Track key metrics
- Explicit trade-offs
Month 2
- 15% debt paydown
- Change recognition
Month 3
- Fix top 3 pain points
- Share trends
You don't fix this overnight.
You fix it consistently.
Discussion Questions for Your Teams
- What percentage of our time goes to unplanned work?
- Who got recognized in our last all-hands? What behavior did that reward?
- When was the last time we were NOT in crisis mode?
- What technical debt do we know about but haven't prioritized? Why?
- If we had a full sprint for quality improvements, what would we fix first?
- How do we currently measure engineering effectiveness? What's missing?
Have these conversations. The answers will be uncomfortable.
That's the point.
30/60/90 Day Roadmap
30 Days
- ✅ Baseline metrics
- ✅ Team discussions
- ✅ Identify pain points
60 Days
- ✅ 15% debt time
- ✅ Update recognition
- ✅ First pain point fixed
90 Days
- ✅ Cycle time improving
- ✅ Less unplanned work
- ✅ Morale rising
Three months to see progress.
Twelve months to transform.
What Success Looks Like
Characteristics:
- Cycle time flat or improving
- Unplanned work <20%
- Deploys are boring (in a good way)
- Engineers excited about codebase
- Leadership trusts engineering estimates
- Quality is everyone's job, not QA's job
This is the compound interest working FOR you.
Resources
Further Reading:
- softwareascraft.com/posts/compound-interest/
- "Accelerate" by Forsgren, Humble, Kim
- DORA State of DevOps Reports
- "The Phoenix Project" by Kim, Behr, Spafford
You're on a curve.
The only question is: which one?
Choose wisely.
Choose today.
Paige Watson

📧 paige.watson@outlook.com
🌐 softwareascraft.com
💼 LinkedIn: @paigeisxp